Introduction: The Map Hidden in Your Eyes
If iridology has a beating heart, it's the chart.
These circular diagrams — sometimes colourful, sometimes clinical — map different organs and systems of the body onto the iris. Whether you're a curious newcomer or a seasoned practitioner, iridology charts remain the most recognisable and captivating part of the field.
And for many people, simply seeing their first chart sparks a revelation:
"Is this really all mapped out inside my eye?"
Today, you'll learn exactly how these charts work, why the left and right eyes differ, how to read the zones, and how modern tools can overlay a digital chart onto your own iris image.
What Is an Iridology Chart?
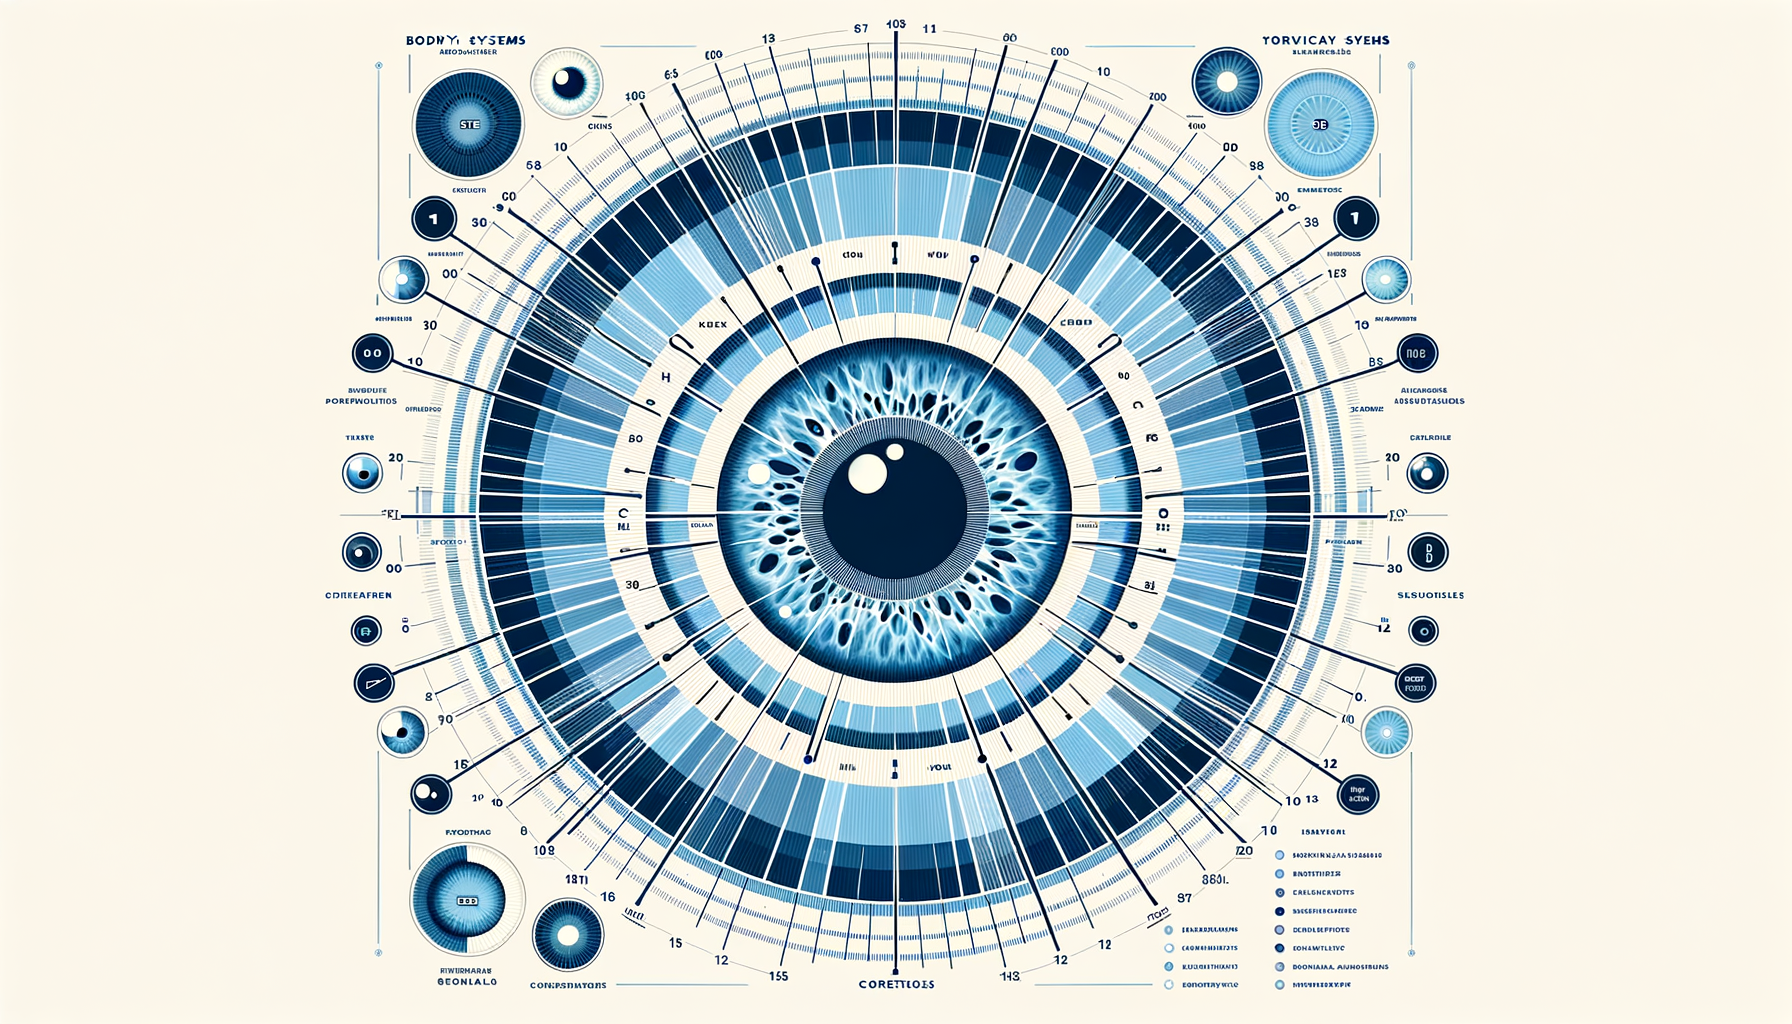
An iridology chart is a diagram that divides the iris into zones, each correlating to a different organ, body system, or functional area.
Most charts use:
- A clock-face layout (12, 3, 6, 9 o'clock etc.)
- Radial zones moving outward from the pupil
- A clear distinction between left and right eyes
Why Left & Right Eye Charts Are Different
One of the most confusing things for newcomers is discovering that each eye has its own chart.
Left Eye → Left Side of the Body
Traditionally linked to:
- Left arm, left leg
- Left kidney
- Spleen
- Left lung
- Heart (in most charts)
- Emotional processing tendencies
Right Eye → Right Side of the Body
Traditionally linked to:
- Liver
- Gallbladder
- Right kidney
- Right lung
- Right arm & leg
- Metabolic tendencies
The 12 "Clock" Zones: What They Represent
The iris is typically divided like a clock face. Below is a simplified breakdown:
12 o'clock – Brain & Head Region
Often associated with cerebrum, skull, cognitive processes, and upper sinuses.
3 o'clock (Right Eye) & 9 o'clock (Left Eye) – Chest
Zones traditionally linked to lungs, bronchi, and upper ribs.
6 o'clock – Pelvic & Lower Abdomen Zones
Often associated with reproductive organs, lower spine, bladder, and lower digestive tract.
See Your Own Iris Mapped Online at Eyescan.me
If you really want to understand iridology charts, the easiest way is to see one overlaid onto your own eye.
At eyescan.me, you can:
- Upload a simple photo
- Get an automated digital chart overlay
- See personalised zones on your own iris
- Read a clear, structured wellness-style report
- Start with a free scan
Final Thoughts: The Chart Is a Map, Not a Verdict
Iridology charts are fascinating because they synthesise anatomy, wellness mapping, constitutional tendencies, and personal exploration.
Understanding the map helps you understand the story your iris might be trying to tell. And thanks to modern online tools, exploring that story has never been more accessible.